ISEF 白皮书增订:读懂学科、案例与 Quad ChartInside the expanded ISEF whitepaper: categories, cases and Quad Charts
学生读完一个获奖项目,常常记住了题目,却还说不清它为什么成立。用了什么对照?一次测量算一个样本,还是一位参与者才算?摘要里的高准确率,能不能支持实际应用?这次增订,我们把这些问题写进了案例解读。After reading a winning project, students often remember the title but struggle to explain the evidence. What was the comparison? Does one measurement count as a sample, or does one participant? Does a high accuracy figure support use outside the study? These questions guide the expanded case readings.
《ISEF 白皮书》增订第三版已经上线,按 2027 赛季准备需要编排。全书 103 页、八章,包含 22 个学科、156 个子类别和 29 个真实案例;其中八个案例进一步拆成 Quad Chart 图解。正文和图解册均可直接阅读、下载。The third expanded edition of the ISEF Whitepaper is now available for students preparing for the 2027 season. The Chinese-language book has 103 pages across eight chapters, covering 22 categories, 156 subcategories and 29 real cases. Eight of those cases receive additional Quad Chart analysis. Both the book and the diagram atlas are available to read and download.
下载完整 PDF(103 页)Download the full PDF (103 pages, Chinese)
下载 Quad Chart 图解册(9 页)Download the Quad Chart atlas (9 pages, Chinese)
先把学科读明白,再决定题目放在哪里Understand the categories before choosing where a project belongs
学科章节逐项解释子类别关注什么问题、通常怎样验证,以及容易混淆的边界。同样是做疾病识别,研究重点可能是算法、疾病机制,也可能是诊断工具。仅凭标题里出现“AI”或“医学”,还不足以判断归类。The category chapter explains the questions each subcategory addresses, common ways to test them and boundaries that are easy to confuse. A disease-detection project might primarily concern an algorithm, a biological mechanism or a diagnostic tool. The words “AI” or “medical” in its title do not settle its category.
每个学科都配有真实项目解读。读者可以对照自己的研究,检查核心贡献落在哪里,再去核对官方类别定义。还没有选题的学生,可以先读第二章;已有课题的学生,适合带着自己的方法和结果查阅。Each category includes a real project reading. Readers can compare the central contribution with their own work before checking the official definitions. Chapter 2 is a useful starting point for students exploring topics; students with an existing project can consult it alongside their methods and results.
Quad Chart 怎样让案例读得更细How Quad Charts make a case easier to examine
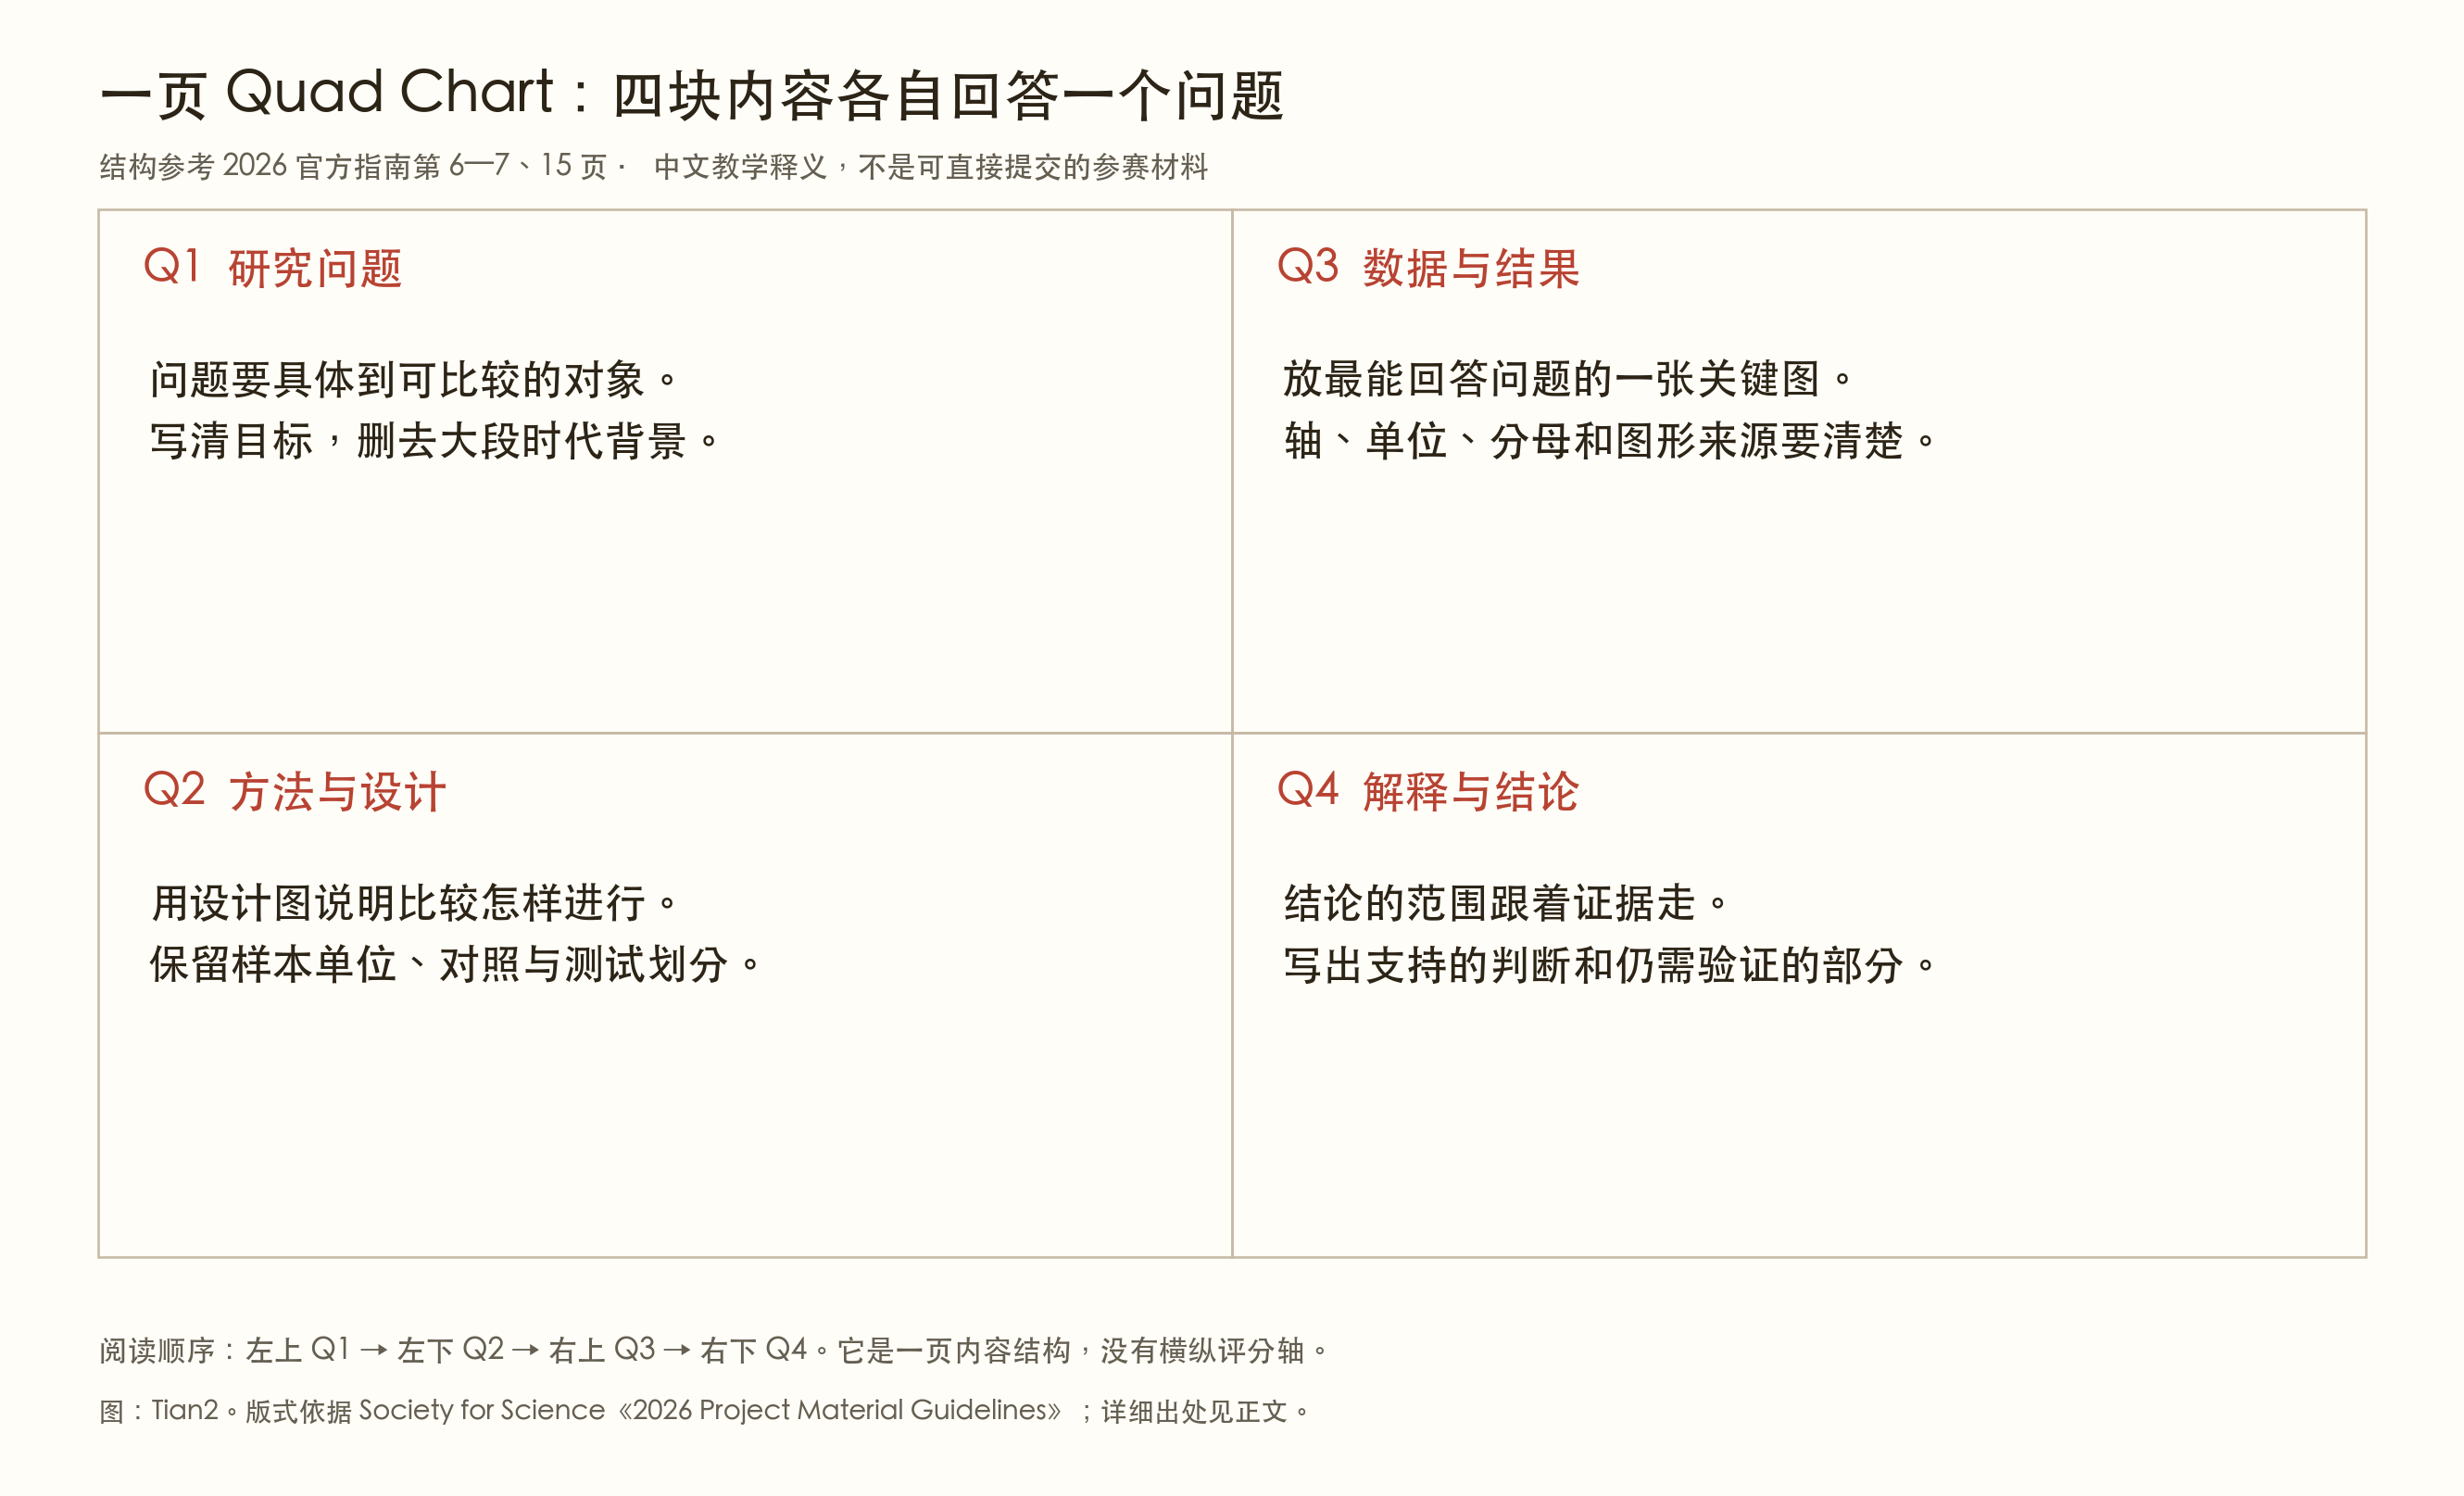
ISEF 材料中的 Quad Chart 是一页四区的研究概览:左上写研究问题,左下写方法,右上放结果,右下解释结果。它和用两条坐标轴给项目定位的“四象限矩阵”是两种图。这版依据 2026 年官方材料指南讲解结构,并把八个公开摘要重新整理成中文教学图。An ISEF Quad Chart is a one-page research summary: question at the upper left, methods at the lower left, results at the upper right and interpretation at the lower right. It differs from a two-axis positioning matrix. This edition explains the structure using the official 2026 material guidelines and redraws eight public abstracts as Chinese teaching diagrams.
图解是 Tian-2 根据官方公开摘要制作的教学重绘,并非学生当年提交的原图,也不代表官方认可。2027 年的实际提交要求仍需查看当季通知。These diagrams are Tian-2 teaching redraws based on official public abstracts, not the students’ original submitted charts or officially endorsed examples. Requirements for actual 2027 submissions should be checked against that season’s notices.
一个降温案例:效果改善之后,还要看代价A cooling case: what does the improvement cost?
2026 年的 CoolSmartAI 项目在摘要中报告,过热时间由 1,193 秒降至 188 秒。不过,制冷量指标同时由 958 增至 1,080 个仿真单位。把两组数据放在同一页,读者就能看到:减少过热并不能直接证明节能,系统可能付出了更多制冷投入。The 2026 CoolSmartAI abstract reports a reduction in overheating time from 1,193 to 188 seconds. Its cooling metric also rises from 958 to 1,080 simulation units. Placing both results on the same page shows why less overheating does not by itself establish energy savings: the system may be using more cooling.
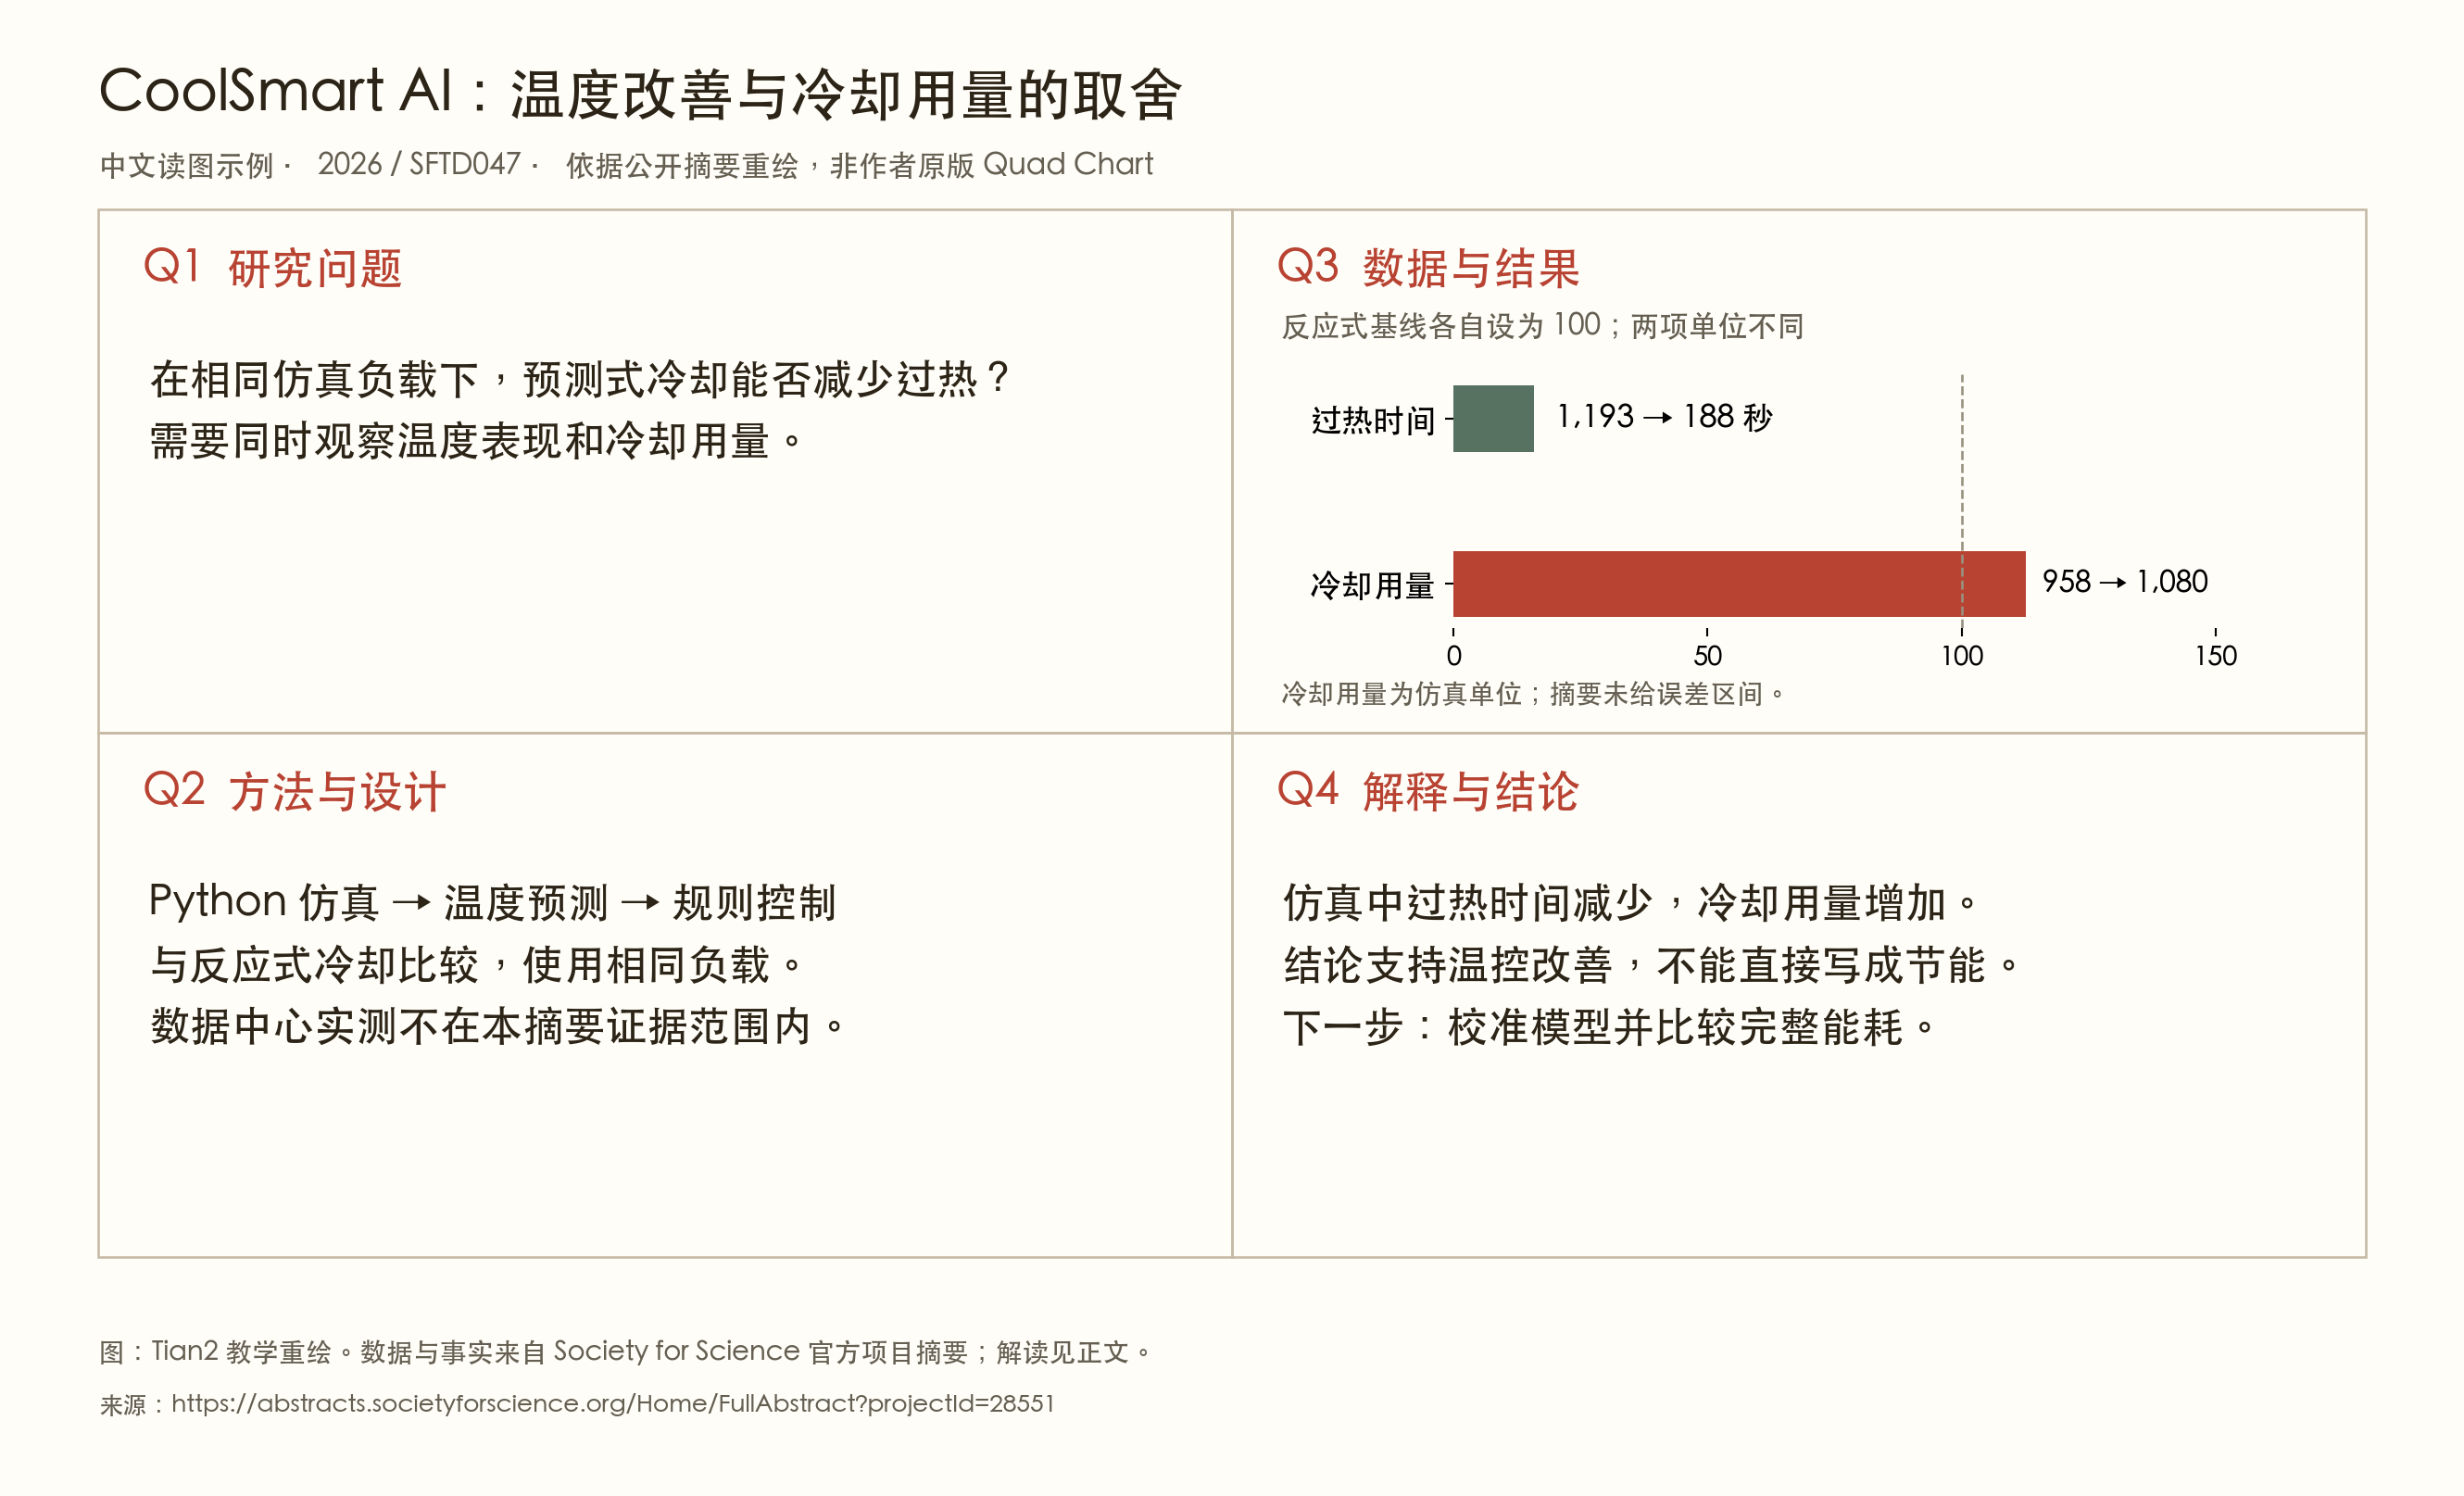
学生可以借这个例子练习写结论:先说明改善了哪个指标,再交代比较条件与代价。接下来的验证也就具体了,例如在相同制冷预算下重新比较,而不是继续堆一个更复杂的模型。Students can use this case to practise writing a conclusion: identify the improved metric, then state the comparison conditions and cost. That also suggests a concrete follow-up, such as comparing the systems under the same cooling budget.
其他案例,会追问不同的问题Other cases raise different questions
医学诊断案例提醒读者,1,800 张图像不等于 1,800 位独立患者;材料案例里,以 N 为单位的拉力不能直接写成应力;数学案例则需要把计算验证和证明分开。行为研究、蜂群健康、泥炭地遥感与文本生成三维模型,也各有一张图,逐步追问摘要能支持什么、还缺什么。The diagnostic case asks readers to distinguish 1,800 images from 1,800 independent patients. The materials case distinguishes a force measured in newtons from stress. The mathematics case separates computational checks from proof. Further diagrams cover behaviour, bee colonies, peatland remote sensing and text-to-3D generation, with attention to what each abstract supports and what remains unknown.
九页图解册包括一页结构说明和八页案例,可单独打印出来讨论。遇到摘要没有公开的数值,图中会保留缺口,不用示意柱高代替实测结果。The nine-page atlas contains one structure guide and eight case diagrams that can be printed for discussion. Where an abstract does not publish a value, the diagram leaves that gap visible rather than inventing a bar to stand in for a measurement.
历年数据能回答什么What the historical data can tell us
数据章节整理了 2014—2026 年的 17,565 条官方项目记录,并单独分析 2022—2026 年的 6,755 个项目。它们可以帮助读者观察学科规模和研究方法的变化,也能为进一步读案例提供线索。The data chapter draws on 17,565 official project records from 2014–2026, including a separate analysis of 6,755 projects from 2022–2026. Readers can examine category sizes and changes in research methods, then use those patterns to find cases worth reading.
读这些图表时,要记住样本来自决赛项目。某学科在这些项目里的获奖比例,不能解释为报名者的获奖概率。书中也分别说明 Grand Awards 与特别奖的统计口径、2020 年停赛以及部分年度奖项字段缺失的影响。These records concern finalist projects. An award share within that set is not an applicant’s probability of winning. The book explains the distinction between Grand Awards and special awards, the cancelled 2020 event and the effect of missing award fields in some years.
按眼下的问题选一章读Choose a chapter around the question you have now
- 尚在选题:读第二章的学科与子类别详解。Exploring topics: read Chapter 2 on categories and subcategories.
- 正在做实验:读第三章的研究设计、记录与展示。Running a study: read Chapter 3 on research design, records and presentation.
- 准备讲项目:读第五章的案例与 Quad Chart 解读。Preparing to present: read Chapter 5 for cases and Quad Chart analysis.
- 想比较历年趋势:读第七章,并先看统计口径。Comparing historical patterns: read Chapter 7, starting with its definitions.
白皮书按 2027 赛季准备需要整理,个别展示材料仍引用已公布的 2026 年指南,正文已分别标注。阅读时请保留这些年份;真正报名或提交材料前,再核对主办方和所属赛区的当季要求。The book is organised for 2027 preparation, while some presentation guidance cites published 2026 documents, with the year marked in the text. Keep those dates in view and check current requirements from the organiser and your affiliated fair before registering or submitting.
相关原始资料:2026 官方展示材料指南、官方评审标准。具体项目出处与数据口径见白皮书各章。Source documents: 2026 official project material guidelines and official judging criteria. Individual project sources and data definitions are linked in the book.